A time-domain finite volume method solver was developed for the simulation of wave propagation in porous media, in which the variables are vertex-centred arrangement and the solver is based on Zwikker and Kosten(Z-K) Model. The boundary condition between porous media and non-viscous fluid was discussed. This approach is validated by serial numerical results.
Introduction
Sound propagation in a porous media is an enduring topic in the file of the acoustic control due to porous acoustic absorbing materials’ cheap and efficiency. They are used in a variety of locations - close to the source of noise, in various paths, and sometimes close to receivers.1 Unlike frequency-domain acoustic simulation which was widely used today, time-domain simulation can provide much more information that helps one understand the propagation process of a sound pulse. During the last two decades, the time-domain simulation of the porous media has been a reborn interest with the development of applications like medical imaging or sound crystals require the study of the sound propagation in the porous medium.2-9
Serial time-domain numerical techniques have been developed to study sound propagation in the porous medium, Most of them use finite-difference time-domain (FDTD) algorithms.10-13 But there is one shortcoming that cannot be ignored that FDTD needs additional process - such as immersed-boundary (IB) method - to adapt to the simulation of objects with complicated geometry. The finite volume method is widely used in fluid dynamics due to it’s strictly conservative and can be formulated on unstructured meshes.14 Xuan et al. has developed an acoustic propagation simulator by time-domain finite volume method.15 In this paper, we extend the algorithm to calculate acoustic propagation in the porous medium using the Z-K model.
The paper is organised as follows: Section 2 presents the equations and limitations of Z-K model in time-domain. The detail schemes of the discretisation of equations are described in Section 3. Example calculations and comparison are provided in Section 4. A porous triangle barrier and two sonic crystals are used to test the numerical methods.
Model equations
The linearized Euler equations are employed for sound propagation in the air medium, while the Zwikker-Kosten (Z-K) equation is applied to account for sound propagation inside the porous medium. The program solves those zones separately each time step.
Outside the porous medium:
Inside the porous medium:11
It is well known that the Wilson Model fits well with the empirical parameters of the porous medium acoustic characters. Figs.1-2 compare predictions from the Z-K and Wilson Models for the impedance and the phase speed when low-frequency approximate values were used for the parameters of Z-K Model. The results are plotted as a function of the normalised frequency . More details on how the comparisons between the Wilson Model and Z-K Model were made can be found in Ref.11. The parameter values chosen for these comparisons are , , , , , , and .
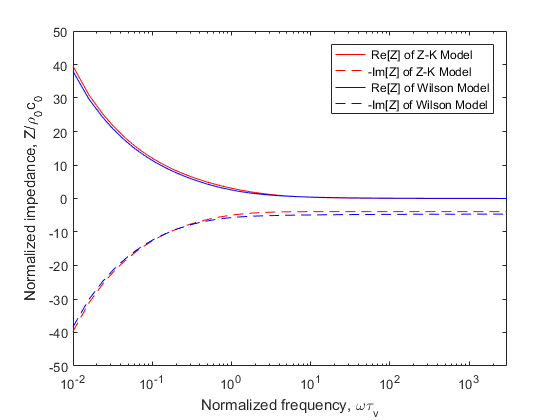
Fig.1. Normalized impedance prediction from the Z-K Model (low frequency) and the Wilson Model. The negative of the imaginary part is plotted. Calculations are shown as a function of the normalized frequency , where is the relaxation time for viscous diffusion in the pores.
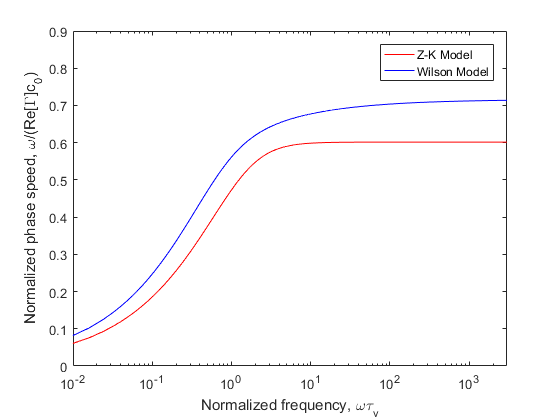
Fig.2. Phase speed predictions from the Z-K Model (low frequency) and the Wilson Model. Plotted is the phase speed divided by the phase speed in air, .
The impedance of two models are nearly identical, but the phase speed of Z-K Model is too low and separate dramatically with the increase of frequency. If we apply high-frequency approximate values of Z-K Model, The continuity equation in will be rewritten as
where is the ratio of specific heats in the air. The impedance and the phase speed of Z-K Model will change a lot as shown in Figs.3-4.
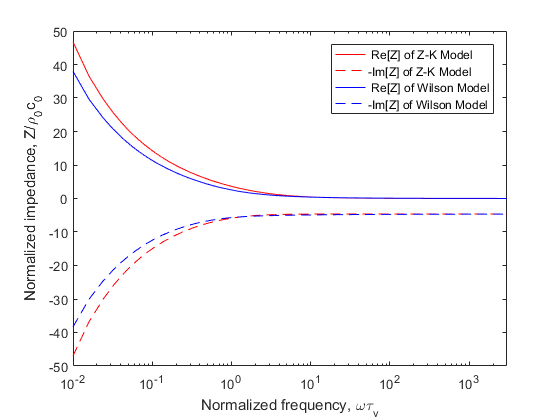
Fig.3. Normalised impedance prediction from the Z-K Model (high frequency) and the Wilson Model. The negative of the imaginary part is plotted. Calculations are shown as a function of the normalised frequency , where is the relaxation time for viscous diffusion in the pores.
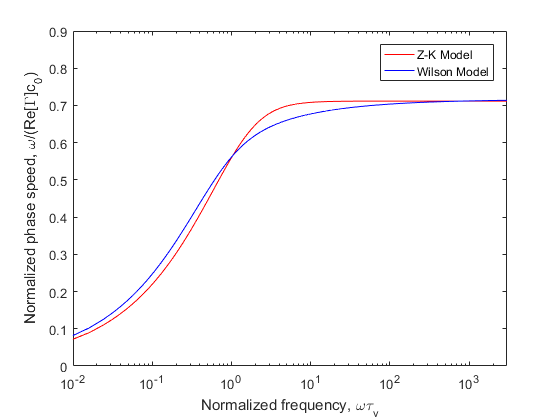
Fig.4. Phase speed predictions from the Z-K Model (high frequency) and the Wilson Model. Plotted is the phase speed divided by the phase speed in air, .
The impedance of the Z-K Model becomes incorrect when , but the phase speed fit better with the Wilson Model. Fig.2 and 4 show that the phase speed becomes independent of frequency for large , whereas it should be actually increase as .
Numerical schemes
In this section, we consider the time-domain numerical implementation of Z-K equations. For the efficiency of calculation,consider simplify the control equation further:Differentiating the continuity equation in by time, grading the movement equation then one can derive that
That is a single variable control equation which means that one need not consider variable coupling and can improve the efficiency of calculating dramatically. There is a high order spatial term in the control equation. The program uses the idea of shape function to solve it (more detail will be given later). We apply Vertical-Centered Finite Volume Method (VC-FVM) to discrete and define the sound pressure on the mesh node. We assume a linear distribution (or quadratic linear distribution) of the sound pressure within the mesh cell. The control volume of the VC-FVM is showed in Fig.5 (the black lines are the mesh elements and black points are the mesh nodes, the control volume of one example node is surrounded by azure faces) and Fig.6 given the assumption of the sound pressure distribution within the 2-D mesh.
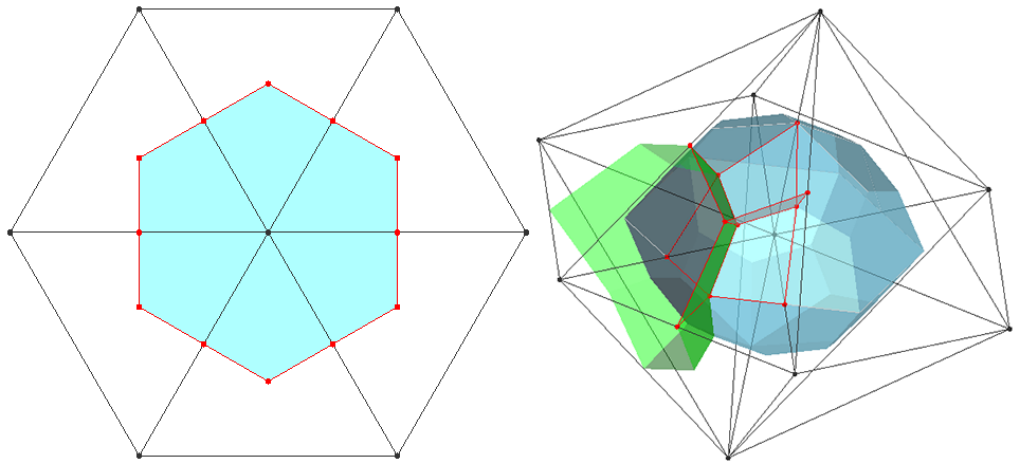
Fig.5. Control volume of the vertex-centred finite volume method (a). 2-D triangle cell (b). 3-D tetrahedron cell.
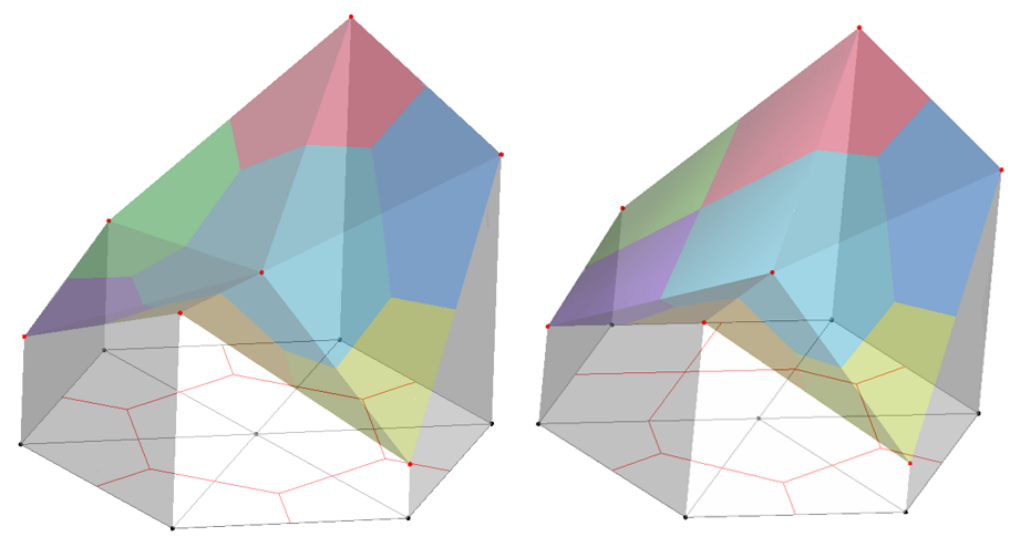
Fig.6. Sound pressure distribution assumed in the 2D mesh, the scale of sound pressure is expressed in height (a). pure triangle cell (b). mixed cell
On any control volume, the integral form of is
Use low order interpolation for the mass term,assume and are uniformly distribution in each control volume as is shown in Fig.7. The discretized equation is
in which , , and refers to the contribution of the area (2-D) or volume (3-D) to that node by the cell.
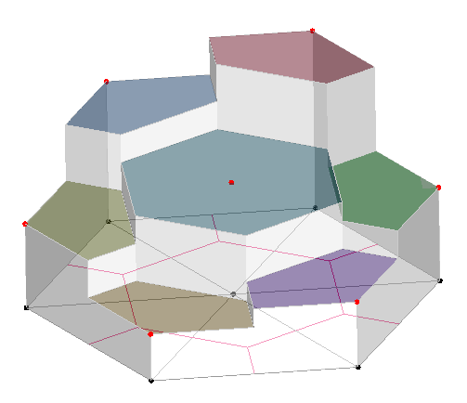
Fig.7. The distribution of sound pressure change rate over time which assumed in the 2-D mesh
We use shape function to calculate the grade of the pressure in the cell,the right side of can be rewritten as
where, and are the shape function of the cell, the value is dependent on the cell shape. In practice, we discrete the time term as
Simulation results
We recalculated a porous triangle barrier given in Ref.13 and the sonic crystals in Ref.9 to test our program. And have made sure that parameter values are the same as each source case, the number of grids in VC-FVM is similar to there source cases.
single triangle barrier
The Gaussian source was applied as the initial condition, with an expression of
where is the distance from the source position, with in pascals and in meters.
For the air, we have the values of , , the speed of sound of air . When considering the barriers as porous media, we specify the porosity , the static flow resistivity , and the porous medium structure factor , following those specified in Ref.13.
The source is located at (0,1.5)m, and the receiver is located at (9,1)m. Considered the differences between Perfect Matching Layer (PML) and the Clay-Engquist-Majda (C-E-M) boundary, the size of the simulation domain is changed to . We use more dense mesh inside the triangular barrier as is shown in Fig.8. The total cell quantity is 4.5 million, similar to 4.92 million of FDTD. The time step is , and the overall simulation time is . The small grid size warrants a sufficient number of grid nodes within a wavelength, approximately 30 points for the highest frequency of interest at . The small time step not only satisfies the stability condition of the scheme15 and the Nyquist rule for the high-frequency requirement but also gives a low CFL number that is needed to avoid generating spurious waves near the interface between the air and the porous medium.
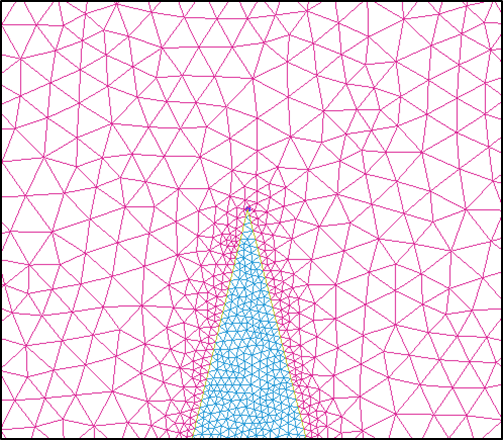
Fig.8. Part of the mesh, the denser mesh was used inside the porous medium.
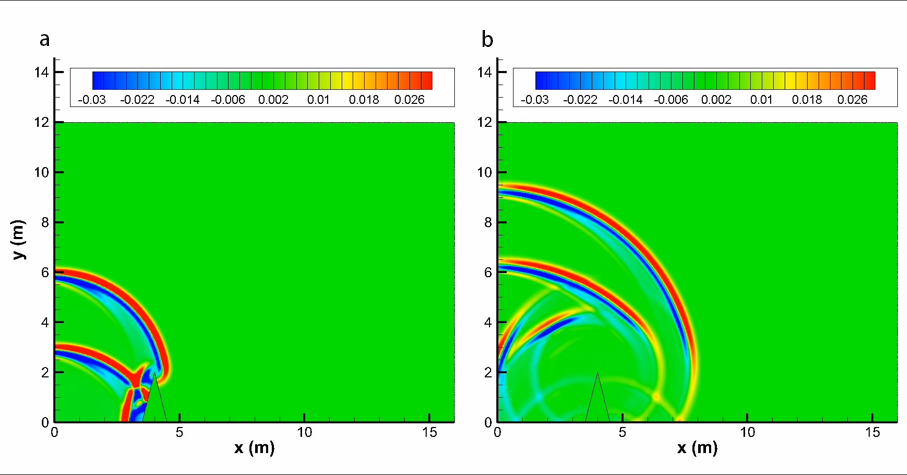
Fig.9. Pressure contours at different times for the single rigid barrier (a). 13 ms (b). 23 ms.
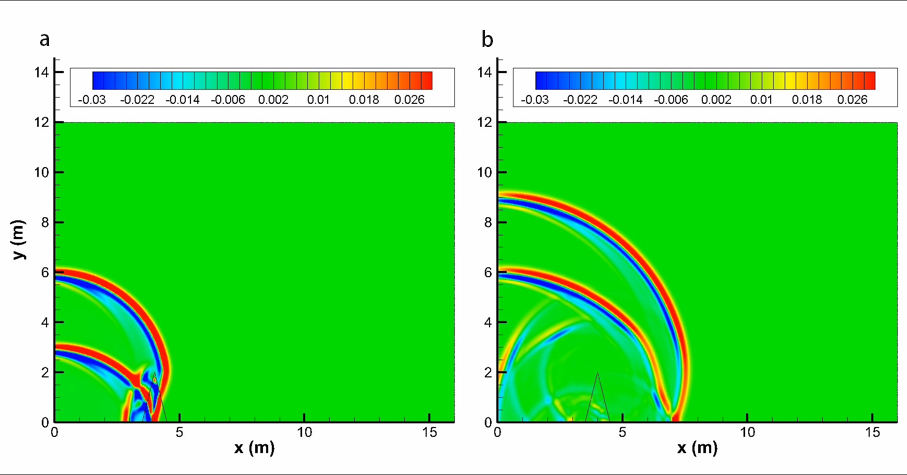
Fig.10. Pressure contours at different times for a triangular porous material barrier with flow resistivity (a). 13 ms (b). 23 ms.
Fig.9 illustrates how sound waves propagate over the single rigid barrier, and Fig.10 shows sound waves penetrate the porous material barrier. To determine the relative sound pressure levels and compare with the FDTD and analytical solutions (only rigid case), we performed a free field computation for sound propagation of the same impulse source to obtain sound pressure and then use the following formula to obtain the relative sound pressure level:
The comparisons with FDTD in time-domain is given in Fig.11, and the corresponding frequency domain contradistinction is given in Fig.12.
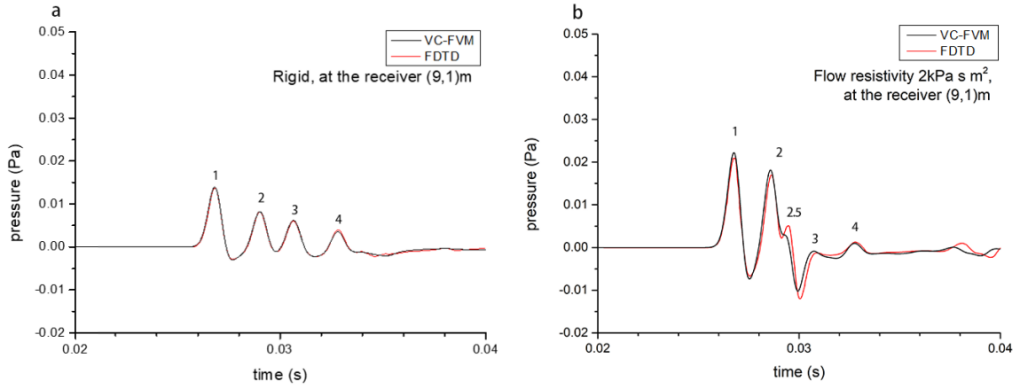
Fig.11. Comparison of time-domain numerical results with FDTD (a). rigid barrier (b). porous material barrier with flow resistivity .
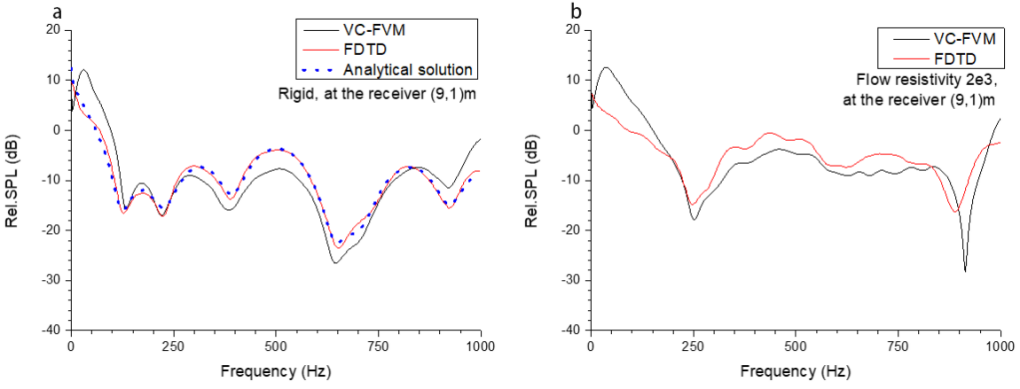
Fig.12. Comparison of frequency domain numerical results with FDTD and analytical solutions (if exist) (a). rigid barrier (b). porous material barrier with flow resistivity .
We numbered some peaks in Fig.11 which you can find corresponding sound pulse propagate route in Fig.13. Most of them fit well with FDTD, but one can find VC-FVM’s “wave 2.5” is propagated faster but weaker than FDTD’s.
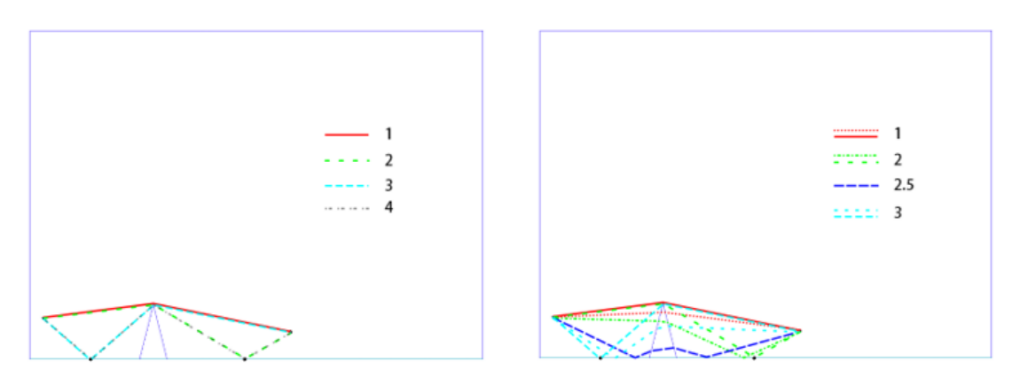
Fig.12. Sound pulse propagate routes (a). rigid barrier (b). porous material barrier with flow resistivity .
sonic crystals
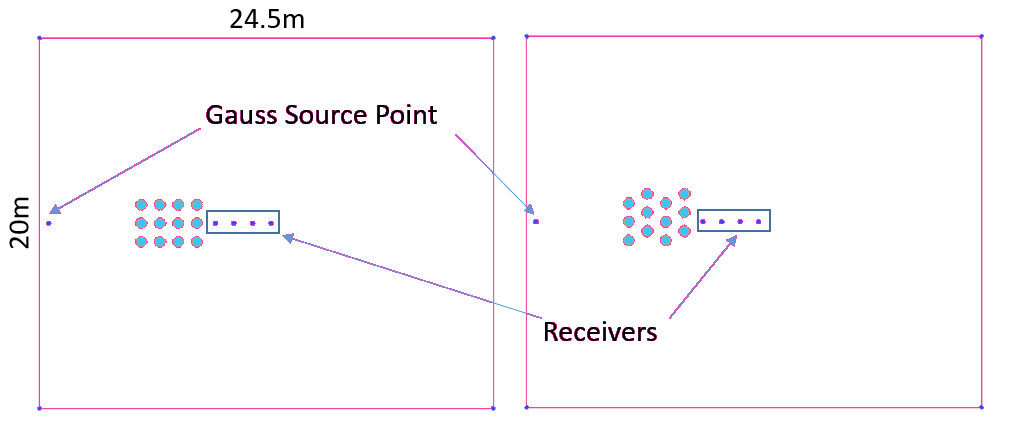
Fig.13. Description of the geometry of the numerical model.
Fig.13 shows the geometry of the numerical model for sound propagation through sonic crystals. The Clay-Engquist-Majda (C-E-M) conditions are specified at all outside boundaries in the cases. The azure zone represents porous medium (parameters are the same with the case triangular barrier). We compared the numerical result of the sound attenuation at the receiver (10,10) as you can see in Fig.14.
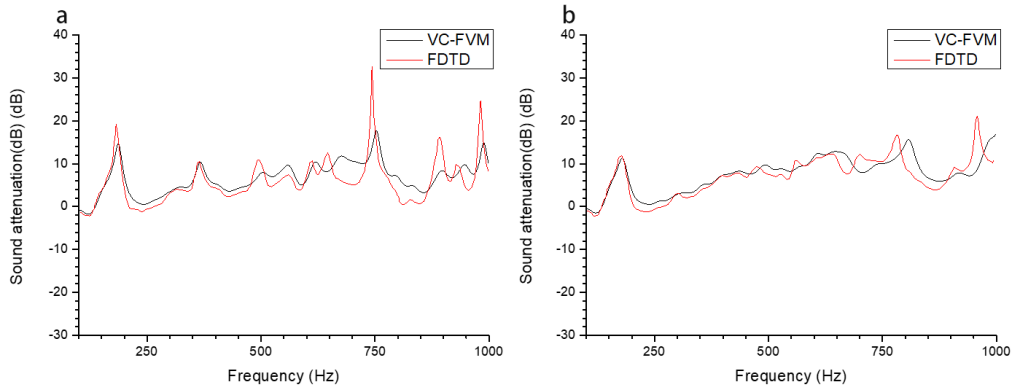
Fig.14. Comparison of the sound attenuation by frequency domain (a). regular square lattice (b). staggered lattice.
Reference
[1] Arenas, Jorge P., and Malcolm J. Crocker. “Recent trends in porous sound-absorbing materials.” Sound & vibration 44.7 (2010): 12-18.
[2] Bouakaz, Ayache, Charles T. Lancée, and Nico de Jong. “Harmonic ultrasonic field of medical phased arrays: Simulations and measurements.” IEEE transactions on ultrasonics, ferroelectrics, and frequency control 50.6 (2003): 730-735.
[3] Hallaj, Ibrahim M., and Robin O. Cleveland. “FDTD simulation of finite-amplitude pressure and temperature fields for biomedical ultrasound.” The Journal of the Acoustical Society of America 105.5 (1999): L7-L12.
[4] Jian, X. Q., et al. “FDTD simulation of nonlinear ultrasonic pulse propagation in ESWL.” 2005 IEEE Engineering in Medicine and Biology 27th Annual Conference. IEEE, 2006.
[5] Fukuhara, Keisuke, and Nagayoshi Morita. “FDTD simulation of nonlinear ultrasonic pulse propagation in ESWL using equations including Lagrangian.” Electrical Engineering in Japan 169.4 (2009): 29-36.
[6] Fellah, Z. E. A., and C. Depollier. “Transient acoustic wave propagation in rigid porous media: A time-domain approach.” The Journal of the Acoustical Society of America 107.2 (2000): 683-688.
[7] Miyashita, Toyokatsu, and Chiryu Inoue. “Numerical investigations of transmission and waveguide properties of sonic crystals by finite-difference time-domain method.” Japanese Journal of Applied Physics 40.5S (2001): 3488.
[8] Hu, Xinhua, C. T. Chan, and Jian Zi. “Two-dimensional sonic crystals with Helmholtz resonators.” Physical Review E 71.5 (2005): 055601.
[9] Ke, Guoyi, and Zhongquan Charlie Zheng. “Sound propagation around arrays of rigid and porous cylinders in free space and near a ground boundary.” Journal of Sound and Vibration 370 (2016): 43-53.
[10] Salomons, Erik M., Reinhard Blumrich, and Dietrich Heimann. “Eulerian time-domain model for sound propagation over a finite-impedance ground surface. Comparison with frequency-domain models.” Acta Acustica united with Acustica 88.4 (2002): 483-492.
[11] Wilson, D. Keith, et al. “Time-domain calculations of sound interactions with outdoor ground surfaces.” Applied Acoustics 68.2 (2007): 173-200.
[12] Van Renterghem, Timothy, Dick Botteldooren, and Kris Verheyen. “Road traffic noise shielding by vegetation belts of limited depth.” Journal of Sound and Vibration 331.10 (2012): 2404-2425.
[13] Ke, Guoyi, and Zhongquan Charlie Zheng. “Simulation of sound propagation over porous barriers of arbitrary shapes.” The Journal of the Acoustical Society of America 137.1 (2015): 303-309.
[14] Moukalled, F., L. Mangani, and M. Darwish. “The finite volume method in computational fluid dynamics.” An Advanced Introduction with OpenFOAM and Matlab (2016): 3-8.
[15] Xuan, Ling-kuan, et al. “Time domain finite volume method for three-dimensional structural–acoustic coupling analysis.” Applied Acoustics 76 (2014): 138-149.